From Zero to K3S on Proxmox LXC: Part 3 - Kubernetes Dashboard


In parts 1 and 2 of this series, I set up a K3S cluster and the plumbing necessary to expose HTTP and HTTPS services hosted in the cluster to other machines on my home network.
In this part, I'll install the Kubernetes Dashboard so I can monitor the cluster.
I'm going to need to:
- Install the kubernetes-dashboard into the cluster in a new namespace
- Configure a new ingress resource allowing me to access the dashboard via HTTPS
- Create an admin user and access token allowing me to login to the dashboard
Why does the dashboard need it's own blog post ?
Installing the Kubernetes Dashboard is well documented elsewhere but it was the first application I tried to install in my cluster and there are a few steps required.
Since the goal of this blog series is "Zero to K3S", I wanted to cover the installation process for a 'real' application and the dashboard is a useful example.
Installing the dashboard application
The dashboard can be installed using the AIO manifest,
kubectl apply -f https://raw.githubusercontent.com/kubernetes/dashboard/v2.7.0/aio/deploy/recommended.yamlAnd I can verify the install was successful by checking if pods are up and running the kubernetes-dashboard namespace:
kubectl -n kubernetes-dashboard get pods

NAME                                         READY   STATUS    RESTARTS   AGE
dashboard-metrics-scraper-5657497c4c-2vxnr   1/1     Running   0          7m
kubernetes-dashboard-78f87ddfc-cwcnn         1/1     Running   0          7m
Once installed, I'll create an ingress for the application so I can access it via HTTPS. The manifest for this is basically the same as the test application I described in Part 2.
# Create a certificate secret for the TLS cert we'll use in the ingress
apiVersion: cert-manager.io/v1
kind: Certificate
metadata:
  name: kubernetes-dashboard-tls
  namespace: kubernetes-dashboard
spec:
  commonName: dashboard.cluster.mydomain.org
  secretName: kubernetes-dashboard-tls
  dnsNames:
    - dashboard.cluster.mydomain.org
  issuerRef:
    name: selfsigned
    kind: ClusterIssuer

---

# Configure an ingress for the dashboard service
apiVersion: networking.k8s.io/v1
kind: Ingress
metadata:
  namespace: kubernetes-dashboard
  name: kubernetes-dashboard-ingress
  annotations:
    cert-manager.io/cluster-issuer: selfsigned
    nginx.ingress.kubernetes.io/router.tls: "true"

    # This is important to tell the ingress controller to use HTTPS
    # when forwarding traffic to the dashboard service.  If this isn't
    # here, the browser will receive an HTTP 400 response from the ingress
    nginx.ingress.kubernetes.io/backend-protocol: HTTPS

spec:
  # Tell the ingress resource to use the 'nginx' controller
  ingressClassName: nginx
  tls:
  - hosts:
    - dashboard.cluster.mydomain.org
    secretName: kubernetes-dashboard-tls
  rules:
  - host: dashboard.cluster.mydomain.org
    http:
      paths:
      - path: /
        pathType: Prefix
        backend:
          service:
            name: kubernetes-dashboard
            port:
              number: 443
Manifest creating ingress for kubernetes-dashboard (source)
After applying this manifest and adding dashboard.cluster.mydomain.org to my DNS server (see part 1), I can now open the dashboard in a browser:
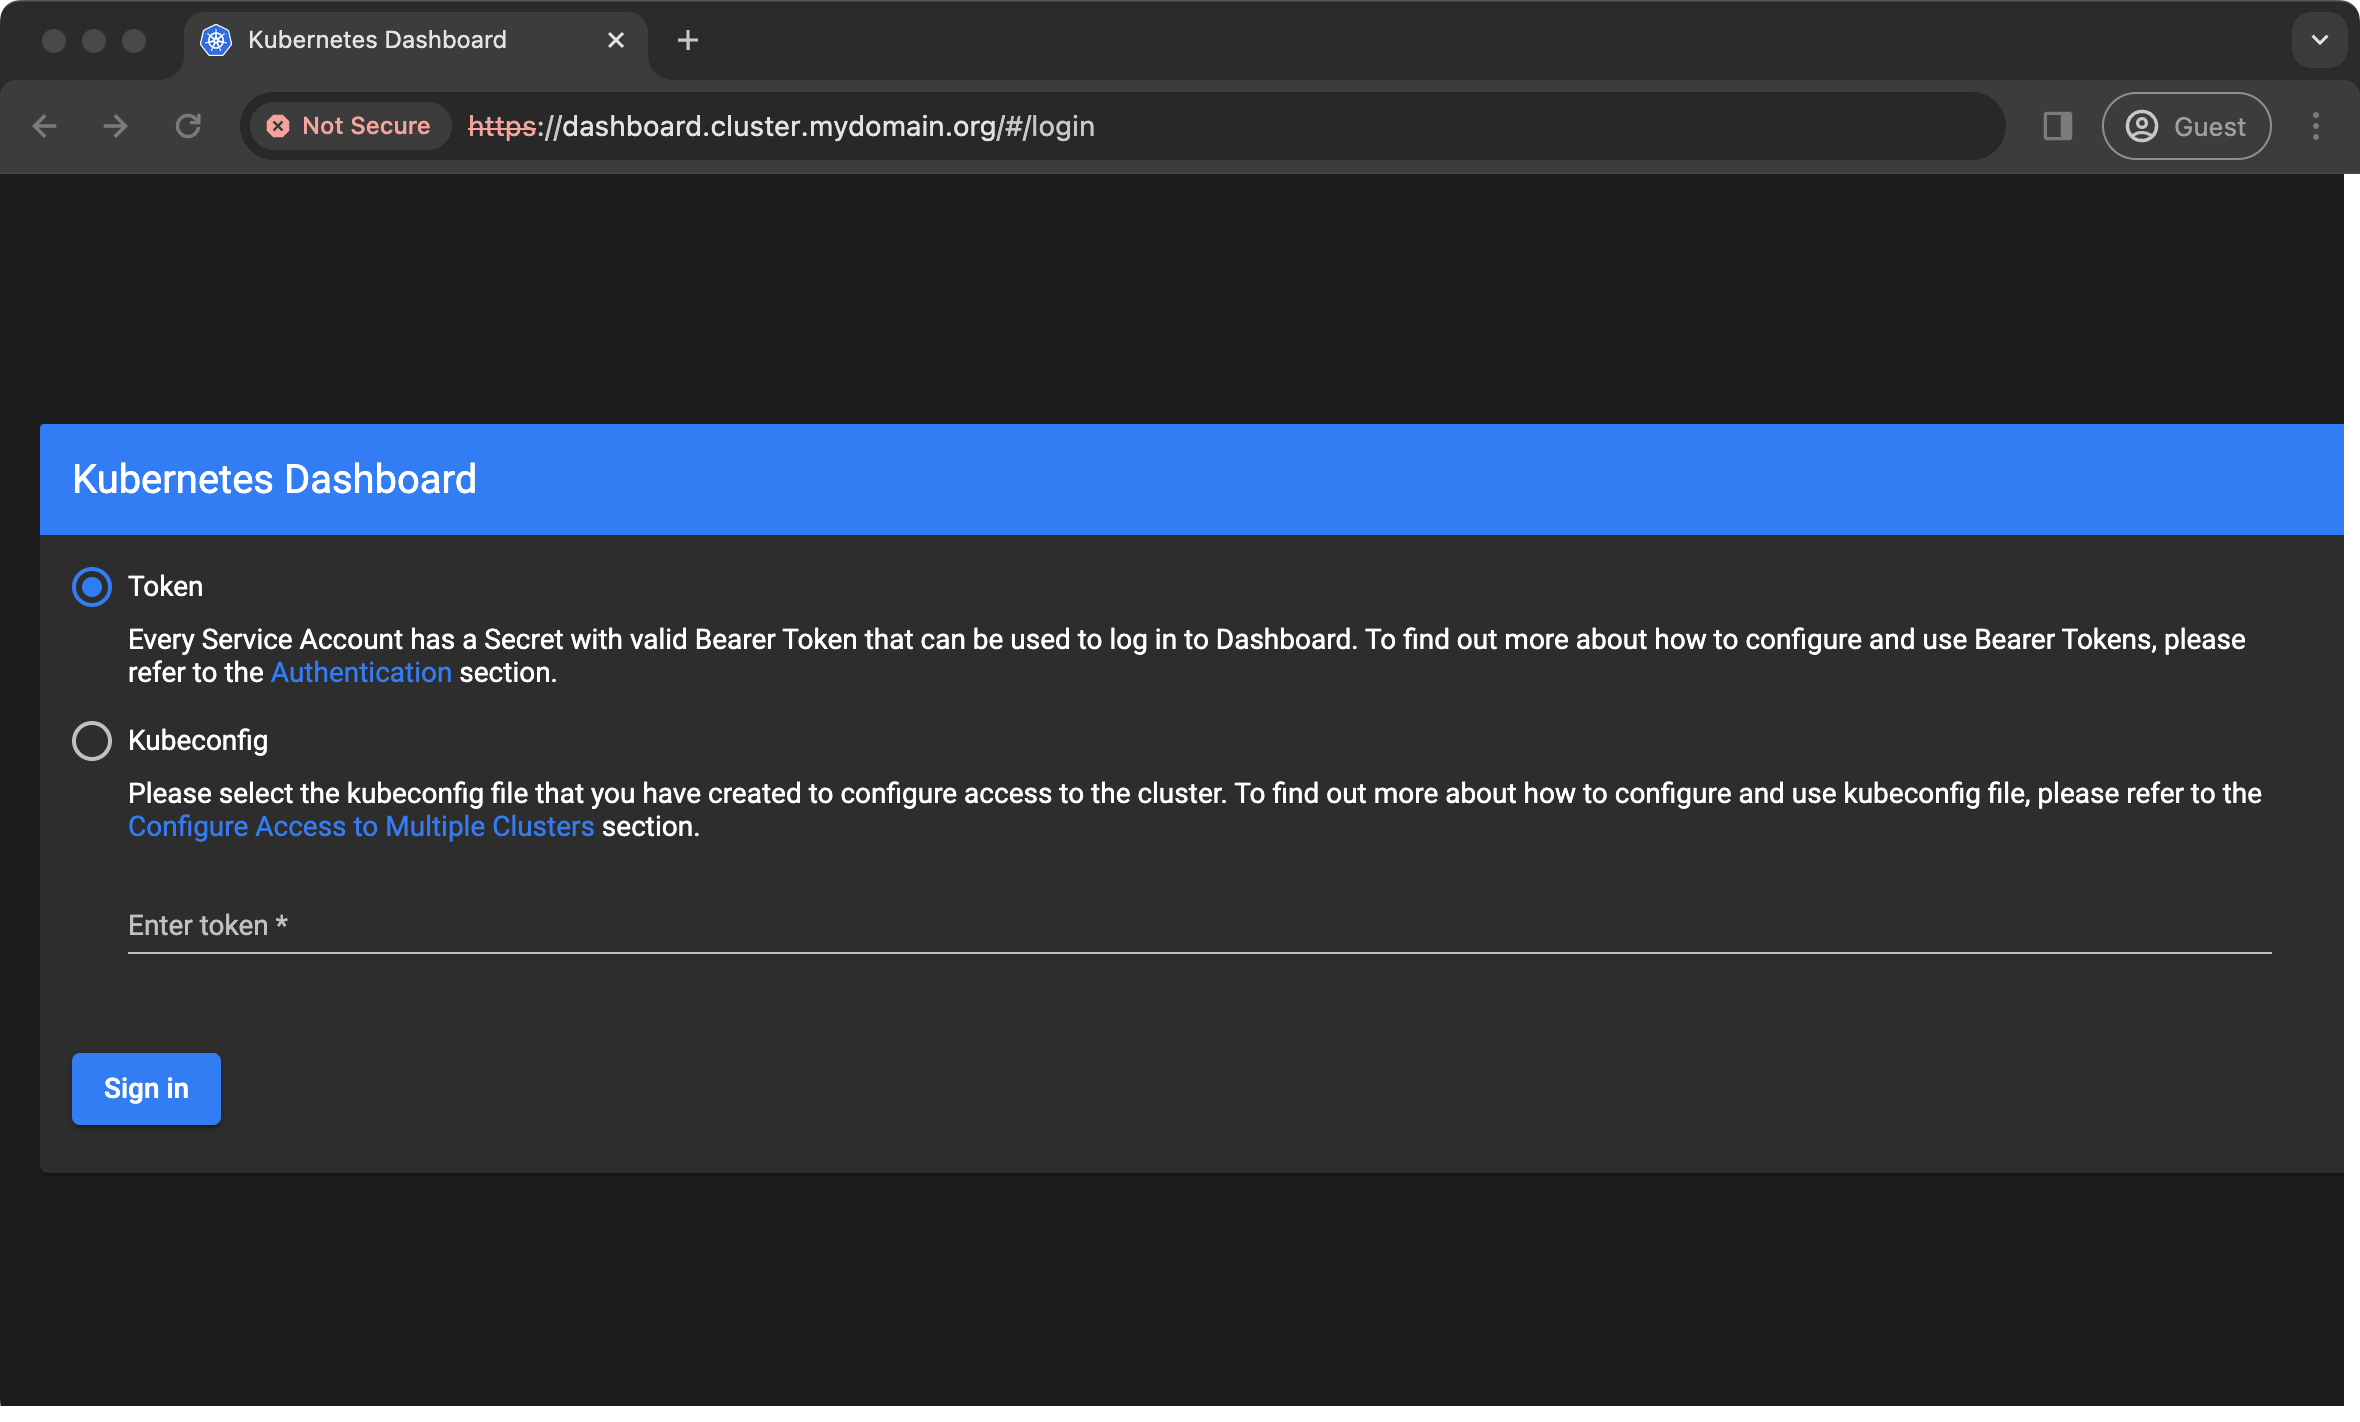
Creating a dashboard user
Although I can open the dashboard, I can't login yet because I don't have a user or access token - I need to create one.
The following manifest creates the admin user, RBAC roles and an access token:
# Create service account 'admin-user'
apiVersion: v1
kind: ServiceAccount
metadata:
  name: admin-user
  namespace: kubernetes-dashboard

---

# Create ClusterRoleBinding for service account 'admin-user'
apiVersion: rbac.authorization.k8s.io/v1
kind: ClusterRoleBinding
metadata:
  name: admin-user
  namespace: kubernetes-dashboard
roleRef:
  apiGroup: rbac.authorization.k8s.io
  kind: ClusterRole
  name: cluster-admin
subjects:
- kind: ServiceAccount
  name: admin-user
  namespace: kubernetes-dashboard

---

# Create service account bearer token
apiVersion: v1
kind: Secret
metadata:
  name: admin-user
  namespace: kubernetes-dashboard
  annotations:
    kubernetes.io/service-account.name: "admin-user"
type: kubernetes.io/service-account-token
Manifest for creating dashboard user (source)
After applying this manifest, I have a user and access token created and now I need to access the token in order to login with it:
kubectl -n kubernetes-dashboard describe secret $(kubectl -n kubernetes-dashboard get secret | grep admin-user | awk '{print $1}')This should output some information including the token I need:
Name:         admin-user
Namespace:    kubernetes-dashboard
Labels:       <none>
Annotations:  kubernetes.io/service-account.name: admin-user
              kubernetes.io/service-account.uid: c6e3d018-aa4c-4376-95e3-c5bacc897748

Type:  kubernetes.io/service-account-token

Data
====
ca.crt:     570 bytes
namespace:  20 bytes
token:      eyJhbGciOiJSUzI1NiIsImtpZCI6Inp3Z01xcDdYLW1XYnhUZy00UzNJREVpUDJBbmV5X1k4VkU0a045UVlJUlkifQ.eyJpc3MiOiJrdWJlcm5ldGVzL3NlcnZpY2VhY2NvdW50Iiwia3ViZXJuZXRlcy5pby9zZXJ2aWNlYWNjb3VudC9uYW1lc3BhY2UiOiJrdWJlcm5ldGVzLWRhc2hib2FyZCIsImt1YmVybmV0ZXMuaW8vc2VydmljZWFjY291bnQvc2VjcmV0Lm5hbWUiOiJhZG1pbi11c2VyIiwia3ViZXJuZXRlcy5pby9zZXJ2aWNlYWNjb3VudC9zZXJ2aWNlLWFjY29-...
If I copy & paste the 'token' field into the dashboard's login page, I get rewarded with a shiny dashboard full of information I don't really understand. It looks meaningful though ;)
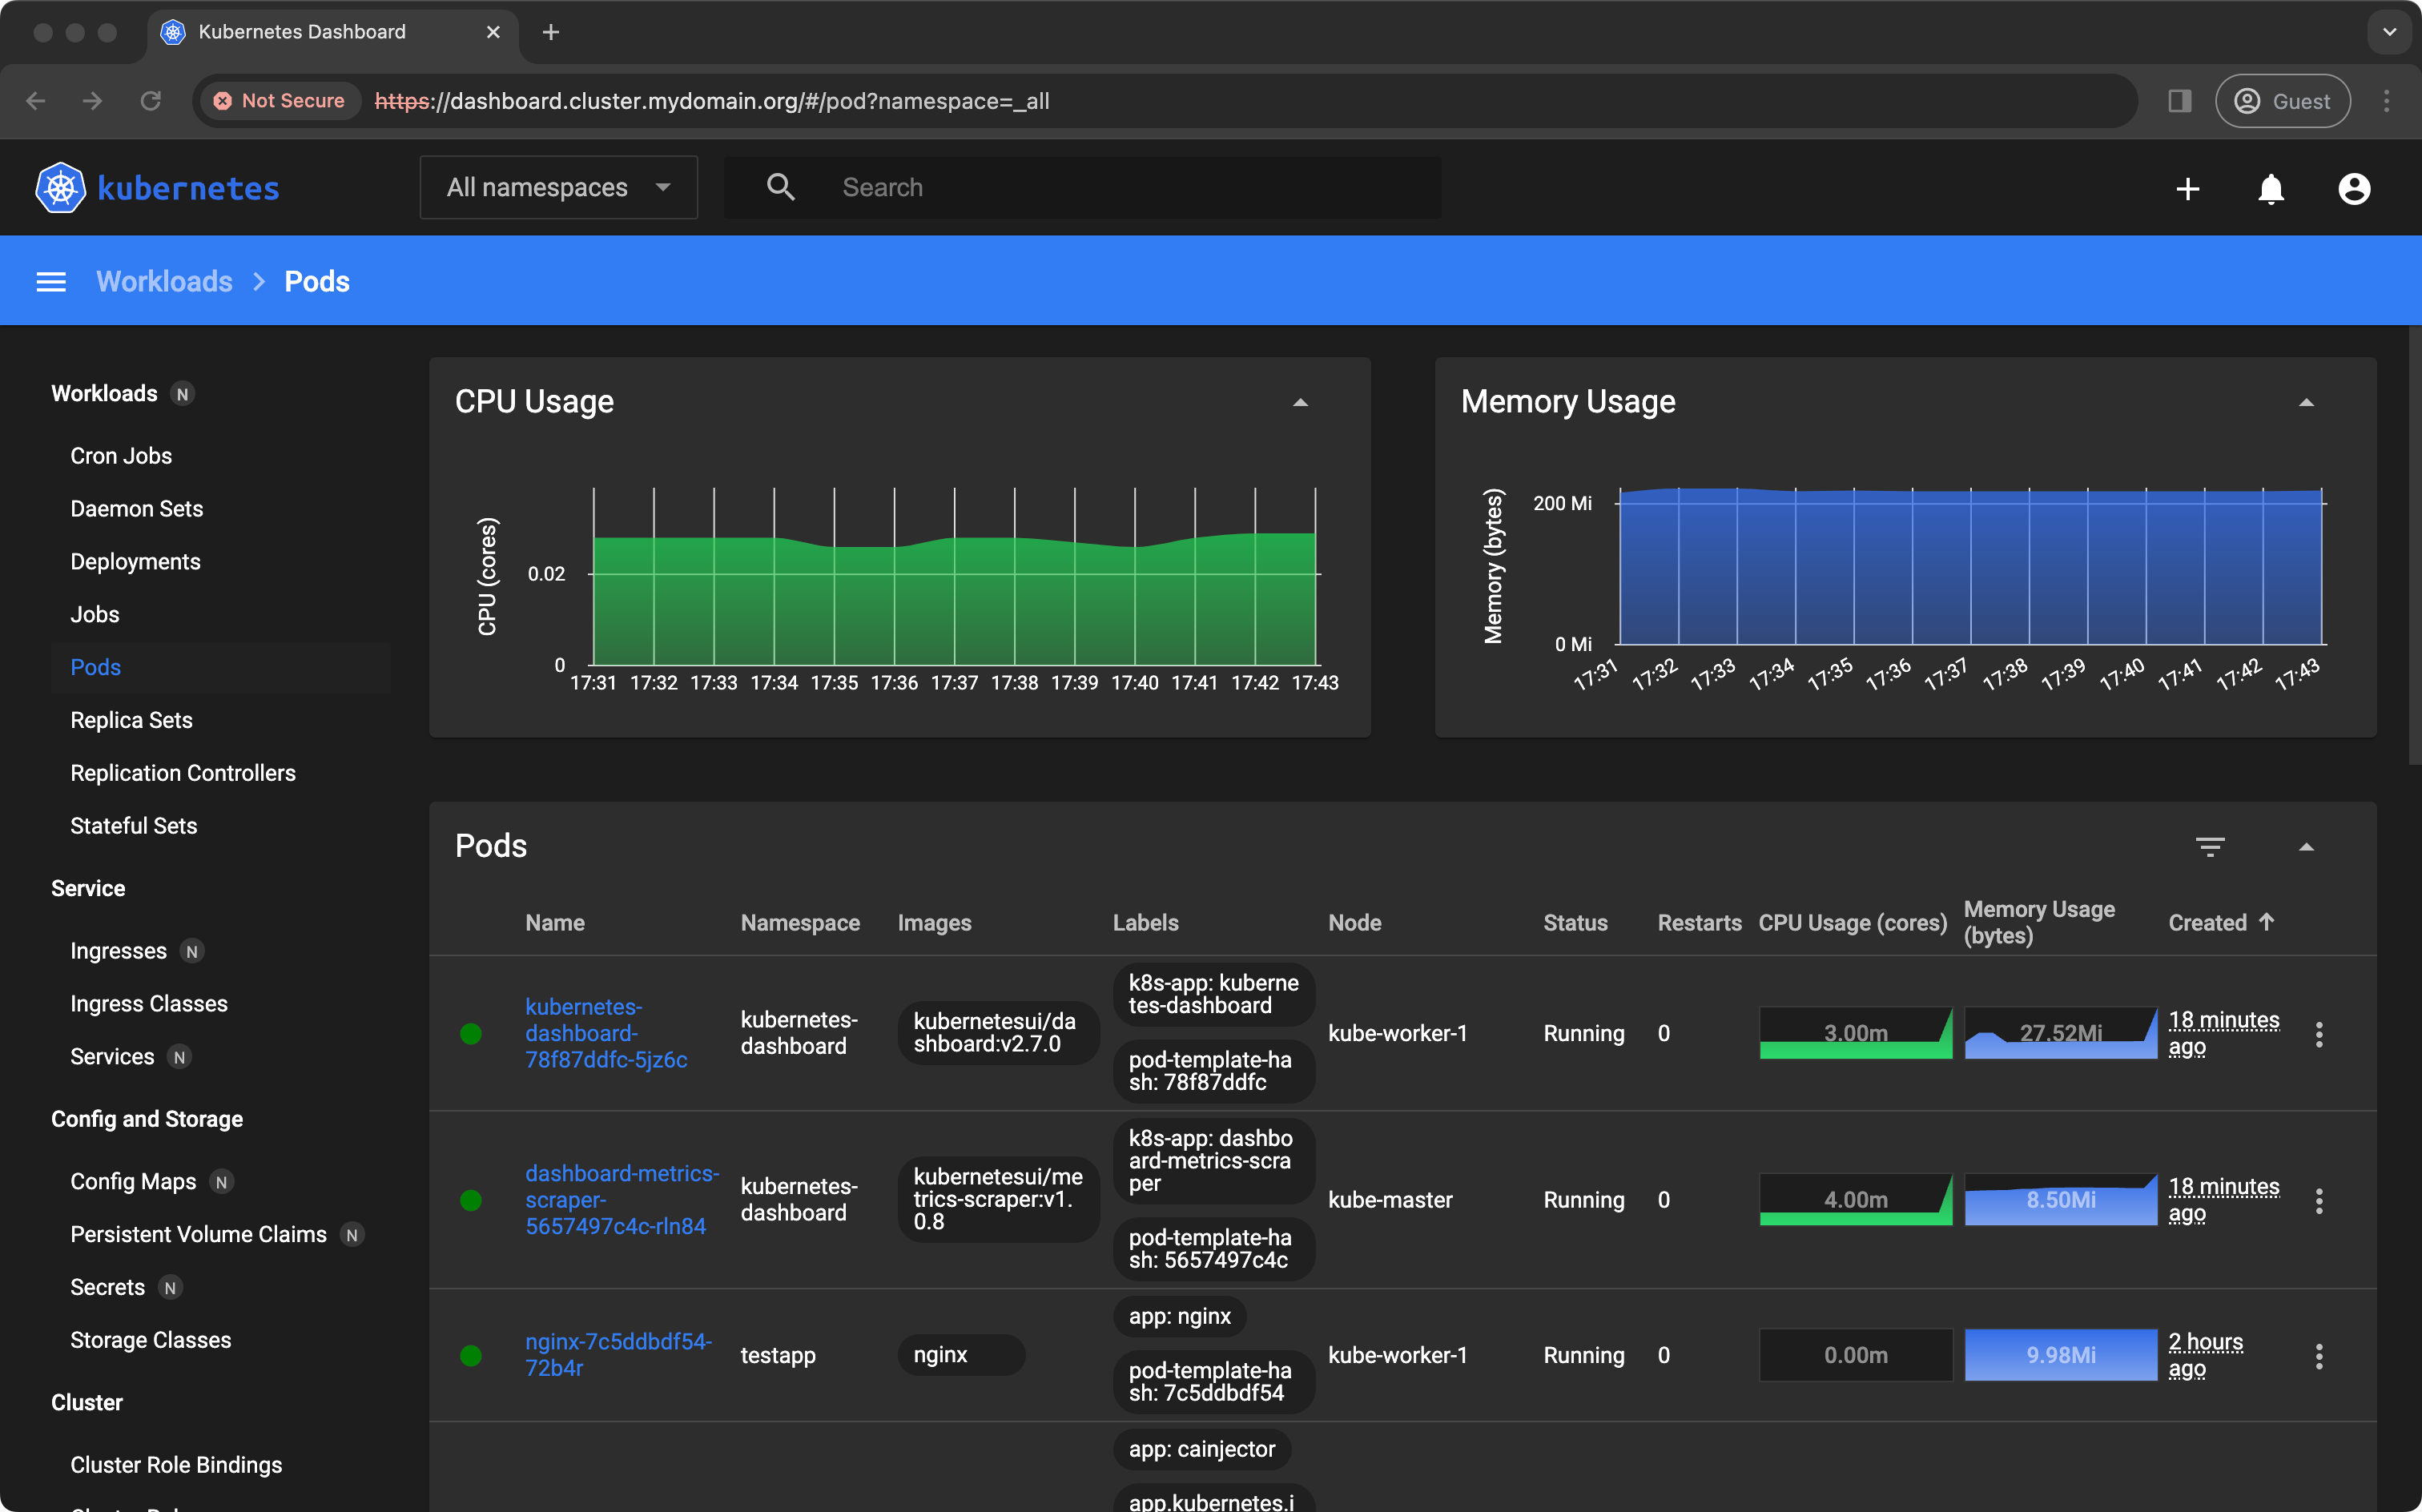
Can I get a w00t w00t 🎉 ?